Viewpoint – Does Agricultural Prosperity Require Supply Management?

In order to justify the continued existence of supply management, producers’ associations state that they could not actually compete on the American market, and that without this system, they would even lose their shares of the domestic market. This Viewpoint aims to show that on the contrary, it is possible for Canadian farmers to be successful on the world market, without benefiting from such protectionist measures.
Media release: Nearly all Canadian farmers prosper without supply management
 Related Content
 |
 |
 |
| Supply management stunts agricultural growth (National Post, August 17, 2017)
Peut-on libéraliser le secteur agricole? (Le Soleil, August 20, 2017) |
Interview with Alexandre Moreau (On The Money, CBC News Network, August 17, 2017) |
This Viewpoint was prepared by Alexandre Moreau, Public Policy Analyst at the MEI. The MEI’s Regulation Series aims to examine the often unintended consequences for individuals and businesses of various laws and rules, in contrast with their stated goals.
The agricultural and agri-food sector represents a substantial part of the Canadian economy, thanks to the fact that Canadian producers and processors can sell their products in the global marketplace.(1) However, this remains foreign ground for the 8% of farms under supply management,(2) a system that makes both exporting and importing practically impossible and that limits production levels to domestic consumption.
In order to justify the continued existence of supply management, producers’ associations state that they could not actually compete on the American market, and that without this system, they would even lose their shares of the domestic market.(3) This Viewpoint aims to show that on the contrary, it is possible for Canadian farmers to be successful on the world market, without benefiting from such protectionist measures.
A Limited Domestic Market
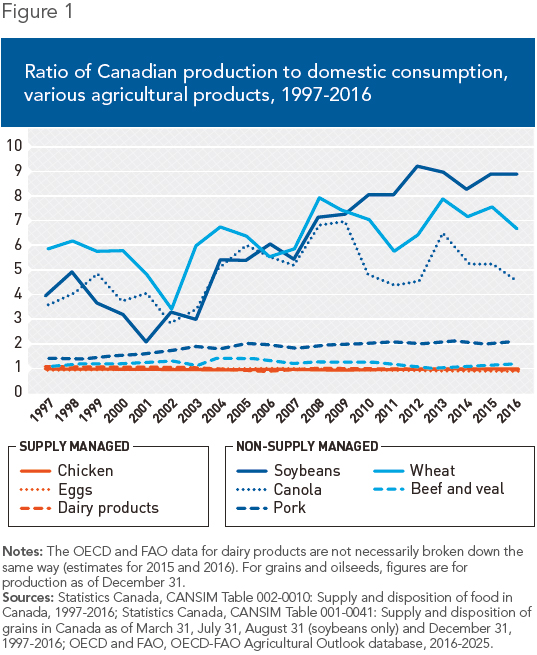
When a sector is subject to a system of quotas and tariffs, as is the case for dairy products, eggs, and poultry, the level of production is generally equal to just about 100% of domestic production, which varies according to consumers’ habits. Dairy production has thus remained relatively stable since the introduction of supply management in 1971, because despite a growing population, milk consumption per capita keeps decreasing.(4)
Canadian dairy producers are therefore unable to benefit from the increase in global consumption to expand their production.(5) As for dairy processors, the saturation of the Canadian market has pushed them to set up shop outside the country in order to meet the global demand.(6)
In contrast, those sectors not subject to these kinds of constraints can produce much more than the level of domestic consumption. The levels of production of soybeans and wheat, for example, have increased considerably over the past fifteen years, totalling 886% and 666% of domestic consumption in 2016, respectively. This means that for each tonne of soybeans consumed in Canada that year, Canadian farmers produced 8.9 tonnes (see Figure 1).

The evolution of the area sown for each type of crop illustrates the adaptive abilities of Canadian producers faced with price and global demand fluctuations. For example, the seeded area of soybean fields has tripled in response to the growth of consumption over the past twenty years.(7)
Faced with international competition, agricultural producers also have strong incentives to innovate in order to reduce their production costs and thus respond to global demand for the highest value-added products. Over the past twenty years, the average yield per acre of canola harvests has almost doubled, whereas for soybeans, oats, and wheat, it has grown by 15%, 52%, and 71% respectively.(8)
This has occurred despite the fact that subsidies and support measures for producers outside of supply management have been considerably reduced and in recent years have represented less than 3% of gross revenues, compared to 43% for milk production.(9)
In 2016, Canada was the 3rd biggest exporter of oilseeds in the world,(10) and 5th in terms of beef and veal.(11) In all, nearly 60% of Canada’s agricultural and agri-food production is destined for foreign markets, more than half of which heads to the American market. This places Canada 5th in the world in terms of exports of agricultural and agri-food products.(12)
Conclusion
The renegotiation of NAFTA should be seen as an opportunity to abolish the supply management system, with financial compensation for dairy, egg, and poultry producers,(13) and to pursue the liberalization of the agricultural and agri-food sector in general.
The time is all the more appropriate for this re-examination given that the possibilities for growth are even more limited for milk producers with the entry into force of the Canada-Europe free trade agreement. In this deal, Canada ceded market shares in order to preserve supply management. Moreover, the limited quantities of dairy product exports allowed by the WTO are contested by Canada’s trading partners, since the export price is lower than the domestic price, which constitutes dumping.(14)
Without access to the world market, the level of production in the Canadian agricultural and agri-food sector would be far lower, and thousands of jobs and billions of dollars in revenues would be lost annually. If 92% of farms manage to succeed without supply management, there’s no reason to believe that most of the others could not do so as well.
References
1. In 2014, the agricultural and agri-food sector contributed $108.1 billion to gross domestic product (GDP), or 6.6% of Canada’s total GDP. Agriculture and Agri-Food Canada, An Overview of the Canadian Agriculture and Agri-Food System 2016, April 2016, p. 26. In 2016, total exports for the main agricultural products totalled $25.3 billion. See the Technical Annex on the MEI’s website for more data.
2. Statistics Canada, CANSIM Table 004-0200: Census of Agriculture, farms classified by the North American Industry Classification System (NAICS), 2016.
3. Boston Consulting Group, Analysis of the potential impacts of the end of supply management in the Canadian dairy industry, Study mandated by Agropur Dairy Cooperative, December 2015, pp. 50 and 54.
4. Egg and poultry producers benefited from the growth of domestic demand to increase production, respectively by 55% and 191% since the establishment of the Canadian Chicken Marketing Agency in 1978 (three-year average). Canadian Dairy Information Centre, Dairy Facts and Figures, Per capita consumption of milk and cream in Canada, February 7, 2017; Canadian Dairy Information Centre, Dairy Facts and Figures, Canadian Milk Production from 1920 to 2015 (Calendar Year Basis); Statistics Canada, CANSIM Table 002-0010: Supply and disposition of food in Canada, 1978-2016; Chicken Farmers of Canada, History of Supply Management.
5. Colin A. Carter and Pierre Mérel, “Hidden Costs of Supply Management in a Small Market,” Canadian Journal of Economics, Vol. 49, No. 2, May 2016, pp. 555-588.
6. Damon van der Linde, “Agropur looking for growth in U.S. while defending Canada’s quota system,” Financial Post, February 10, 2016; Sissi Wang, “Canada’s dairy giant Saputo is targeting emerging markets for growth,” Canadian Business, June 30, 2015.
7. OECD and FAO, OECD-FAO Agricultural Outlook 2017-2026; Statistics Canada, CANSIM Table 001-0010: Estimated areas, yield, production and average farm price of principal field crops, in metric units, 1998-2017.
8. Statistics Canada, ibid., 1997-2016.
9. OECD and FAO, op. cit., endnote 7. For more detailed data about each type of production, see the Technical Annex on the MEI’s website.
10. Copra, cottonseed, palm kernel, peanut, rapeseed, soybean, and sunflower seed.
11. United States Department of Agriculture, Foreign Agricultural Service, PSD Reports, Oilseed, Table 04: Major Oilseeds: World Supply and Distribution (Country View) and PSD Reports, Livestock, Table 04: Beef and Veal Trade: World Supply and Distribution (Country View) – Selected Countries Summary, June 9, 2017.
12. This refers to volume of exports of primary and processed agricultural products for the year 2014. Agriculture and Agri-Food Canada, op. cit., endnote 1, pp. 32-34.
13. The reimbursement of the accounting value of production quotas over a period of ten years would represent a total payment of $13 billion, or $1.6 billion a year. Vincent Geloso, Alexandre Moreau, and Germain Belzile, “Ending Supply Management with a Quota Buyback,” Viewpoint, MEI, June 1st, 2017.
14. Under the Nairobi Agreement, Canada will lose its export allocation for class 5(d) in 2021, while the new milk class 7 is under threat. “Blame Canada!” Rural News, July 4, 2017; Douglas Hedley and Al Mussell, “The Implications of Existing Milk Marketing Trends in Canada: A Counterfactual Analysis,” Policy Note, Agri-Food, May 2016, p. 1; The Canadian Press, “More American milk: U.S. dairy lobby submits its demands for NAFTA renegotiation,” Financial Post, June 14, 2017.

